

Reduce the stream
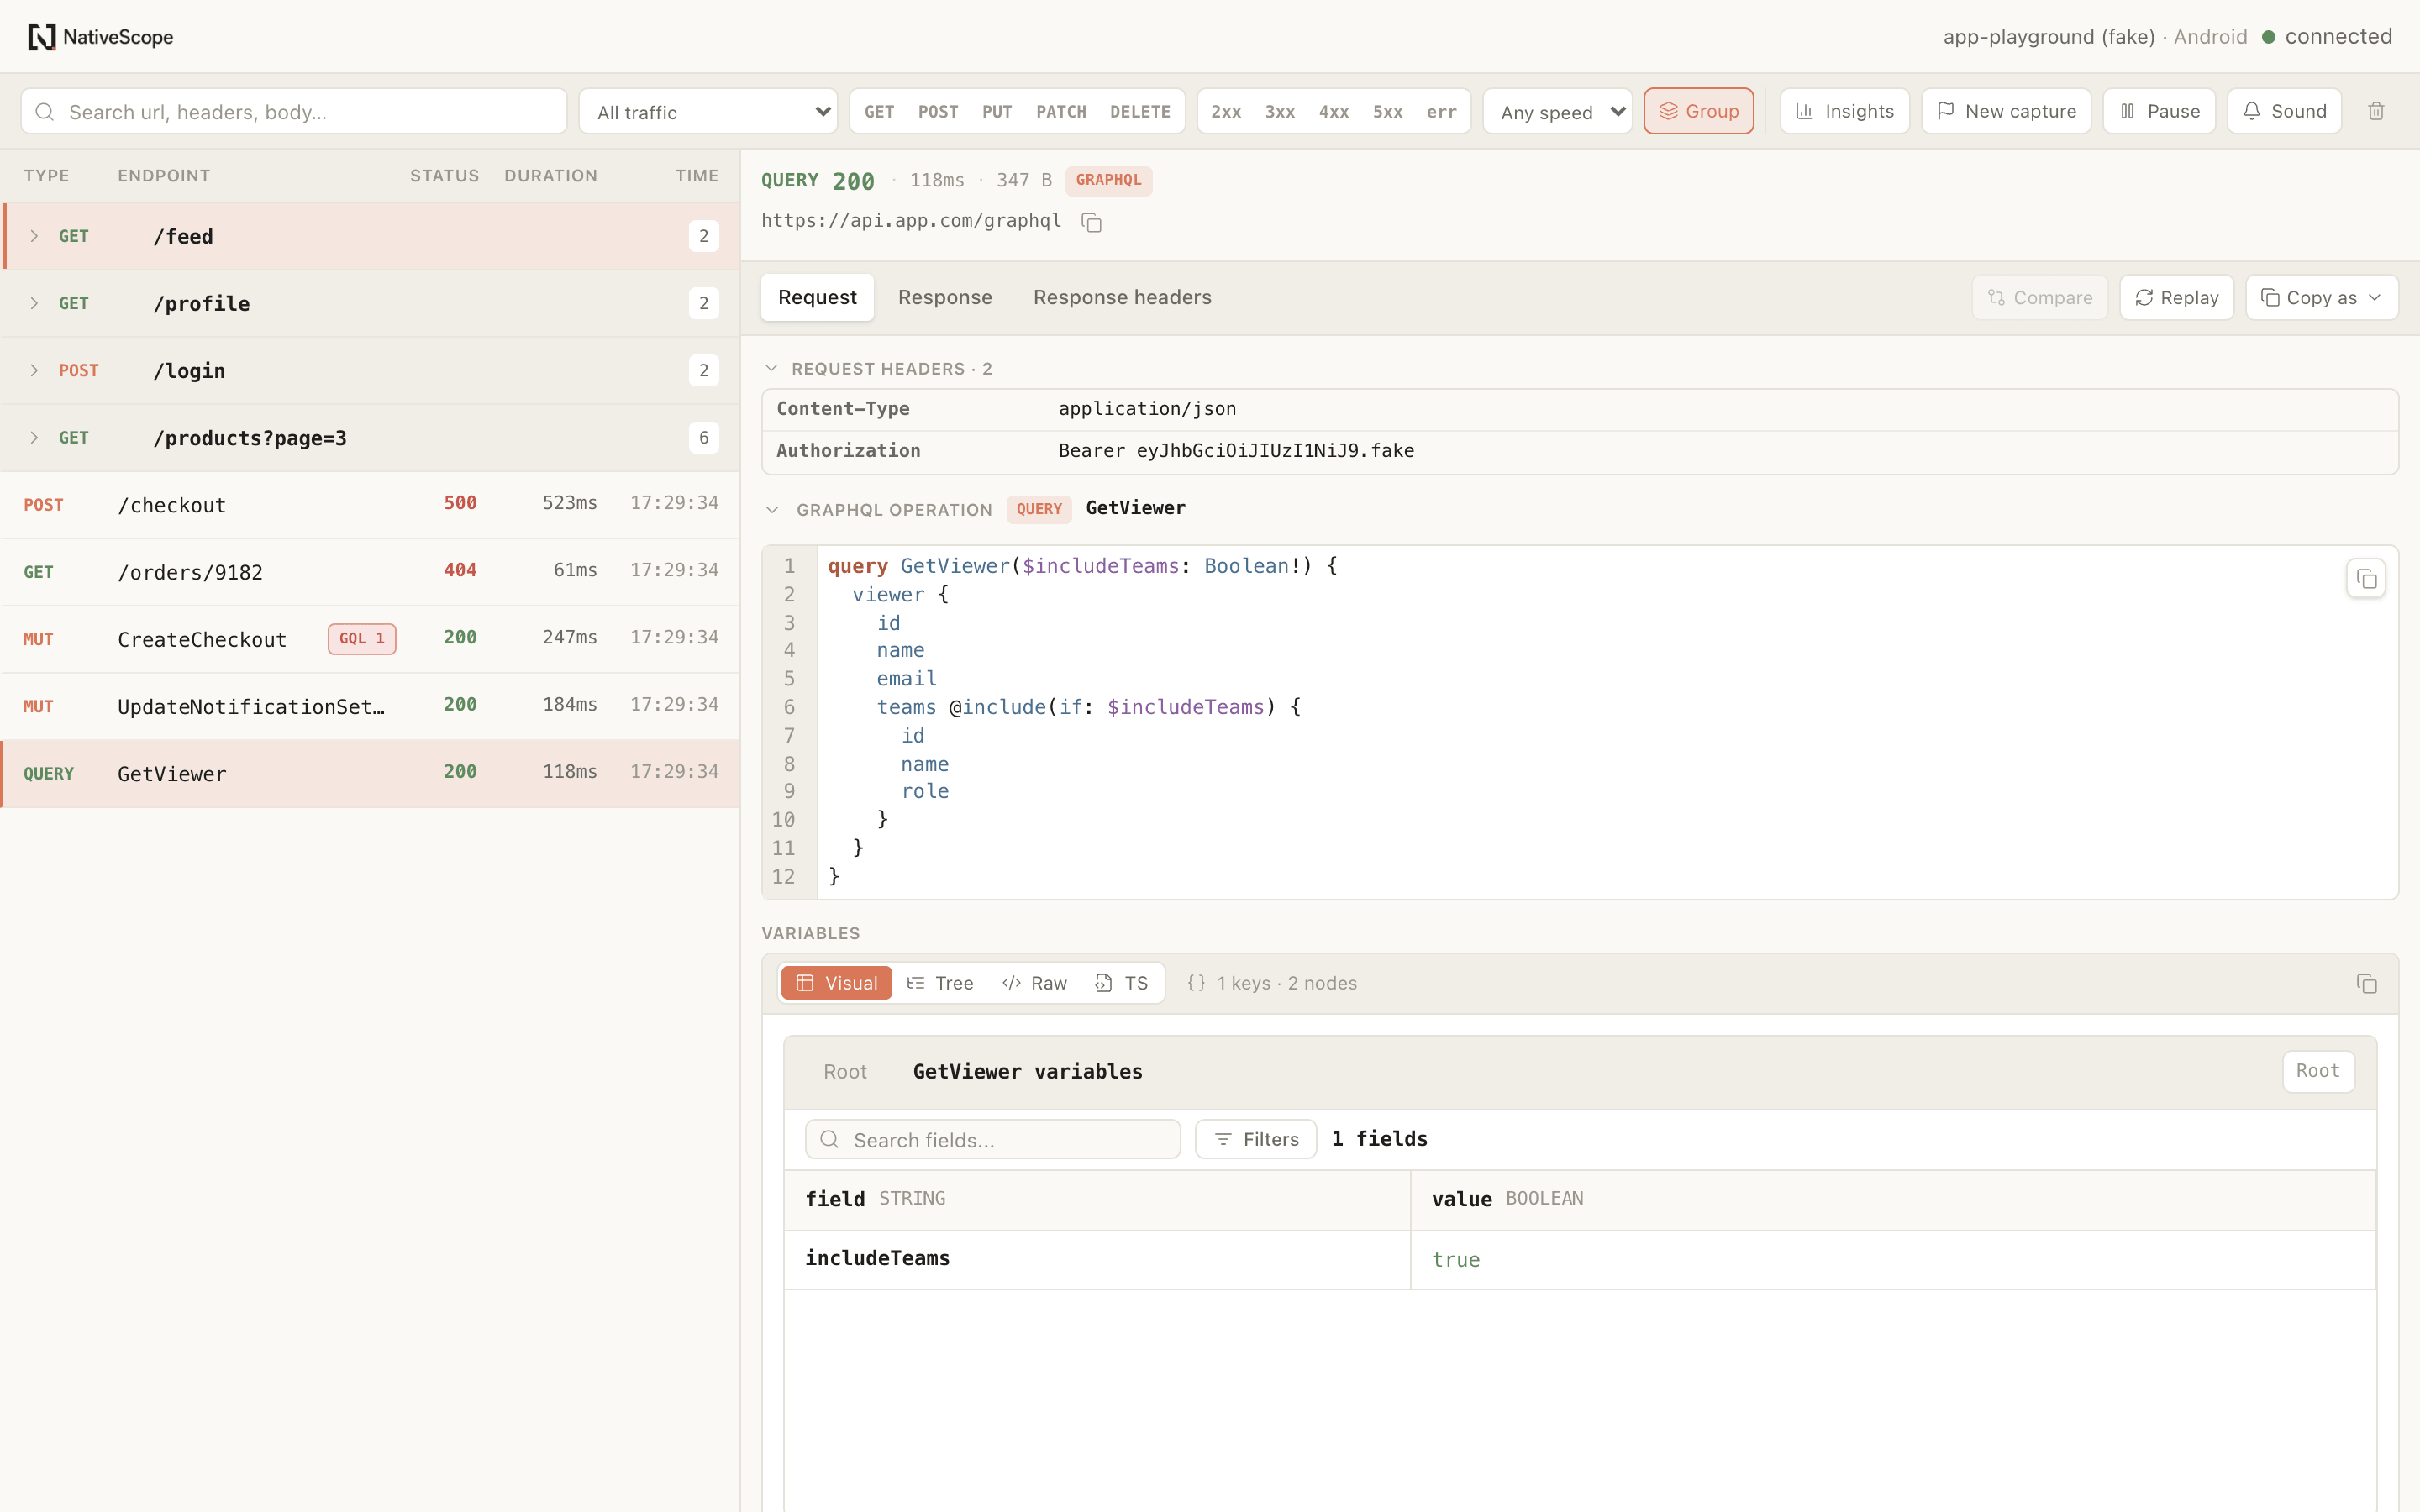
Search inside URL, headers and body, combine structured filters and group repeated endpoints before opening a request.
Technical comparison · Network
 ReactotronReactotron
A modular local React Native debugging environment. Network is a dedicated workspace beside Storage.
An established general-purpose React and React Native debugger. Networking is one capability among state, logs, errors, performance, overlays, commands and plugins.
Instruments global fetch and XMLHttpRequest, including native fetch implementations that do not pass through XHR.
The official networking plugin documents XMLHttpRequest tracking. Apisauce uses a separate monitor integration.
Starts Metro with its resolver attached. The Network module is enabled with network: true in the root config.
Runs as a desktop Electron app. The project creates a Reactotron config, connects the client and imports it from the app entrypoint in development.
Live search across URL, headers and body, plus method, status class and duration filters. Repeated endpoints can be grouped.
Network events share Reactotron's broader event timeline. The networking docs expose regex exclusions for URLs and response content types.
Separate Request, Response and Response headers views, with a navigable read-only JSON workspace for large payloads.
Displays API requests and responses as part of the cross-tool timeline, keeping network activity near logs and state events.
Structured query, header and body editing; original or current-session credentials; replay tags and repeated-execution comparison.
Replay and request comparison are not documented capabilities of the official networking plugin.
Associates storage changes that happen after a response and opens the affected key directly in Storage.
Offers networking and storage plugins, but the official docs do not describe per-request correlation between them.
Documents configurable limits for request history, fast previews, retained full bodies, URL exclusions and sensitive headers.
Documents URL and content-type exclusions for networking. Its desktop network retention and body limits are not described on that plugin page.
The Metro resolver serves original modules to release builds; CI also checks that the development shim is absent.
Installed as a dev dependency. The official guide imports the config behind __DEV__ so the client does not connect in production.
Teams that want a focused network workflow, editable replay and direct context across request and storage.
Teams that want network events inside a mature, extensible debugger covering many areas of the running app.
The pains we designed around
Search inside URL, headers and body, combine structured filters and group repeated endpoints before opening a request.
Move from raw data into navigable JSON tables, wrap long values and keep response headers in their own view.
Edit query parameters, headers and JSON body while choosing captured or current credentials.
Compare repeated executions, identify storage changes after the response and open the exact affected value.
The NativeScope side, visible
Setup shape
pnpm add -D react-native-nativescope
pnpm nativescope// nativescope.config.ts
import { defineNativeScopeConfig } from "react-native-nativescope/app"
export default defineNativeScopeConfig({
modules: {
network: true,
},
})brew install --cask reactotron
pnpm add -D reactotron-react-native// ReactotronConfig.js
import Reactotron, { networking } from "reactotron-react-native"
Reactotron.configure()
.use(networking())
.connect()// App.js or index.js
if (__DEV__) {
require("./ReactotronConfig")
}Choose NativeScope Network when
You want structured filters, large-payload navigation, editable replay, execution comparison and direct request-to-storage context with minimal app configuration.
Choose Reactotron when
You want a mature desktop debugger that places API traffic beside state, logs, errors, performance, overlays, custom commands and an extensible plugin ecosystem.