

Focus without deleting history
Start a new capture from this moment, keep earlier traffic behind a marker and return to it whenever context matters.
Learn moreNativeScope module 02 · available now
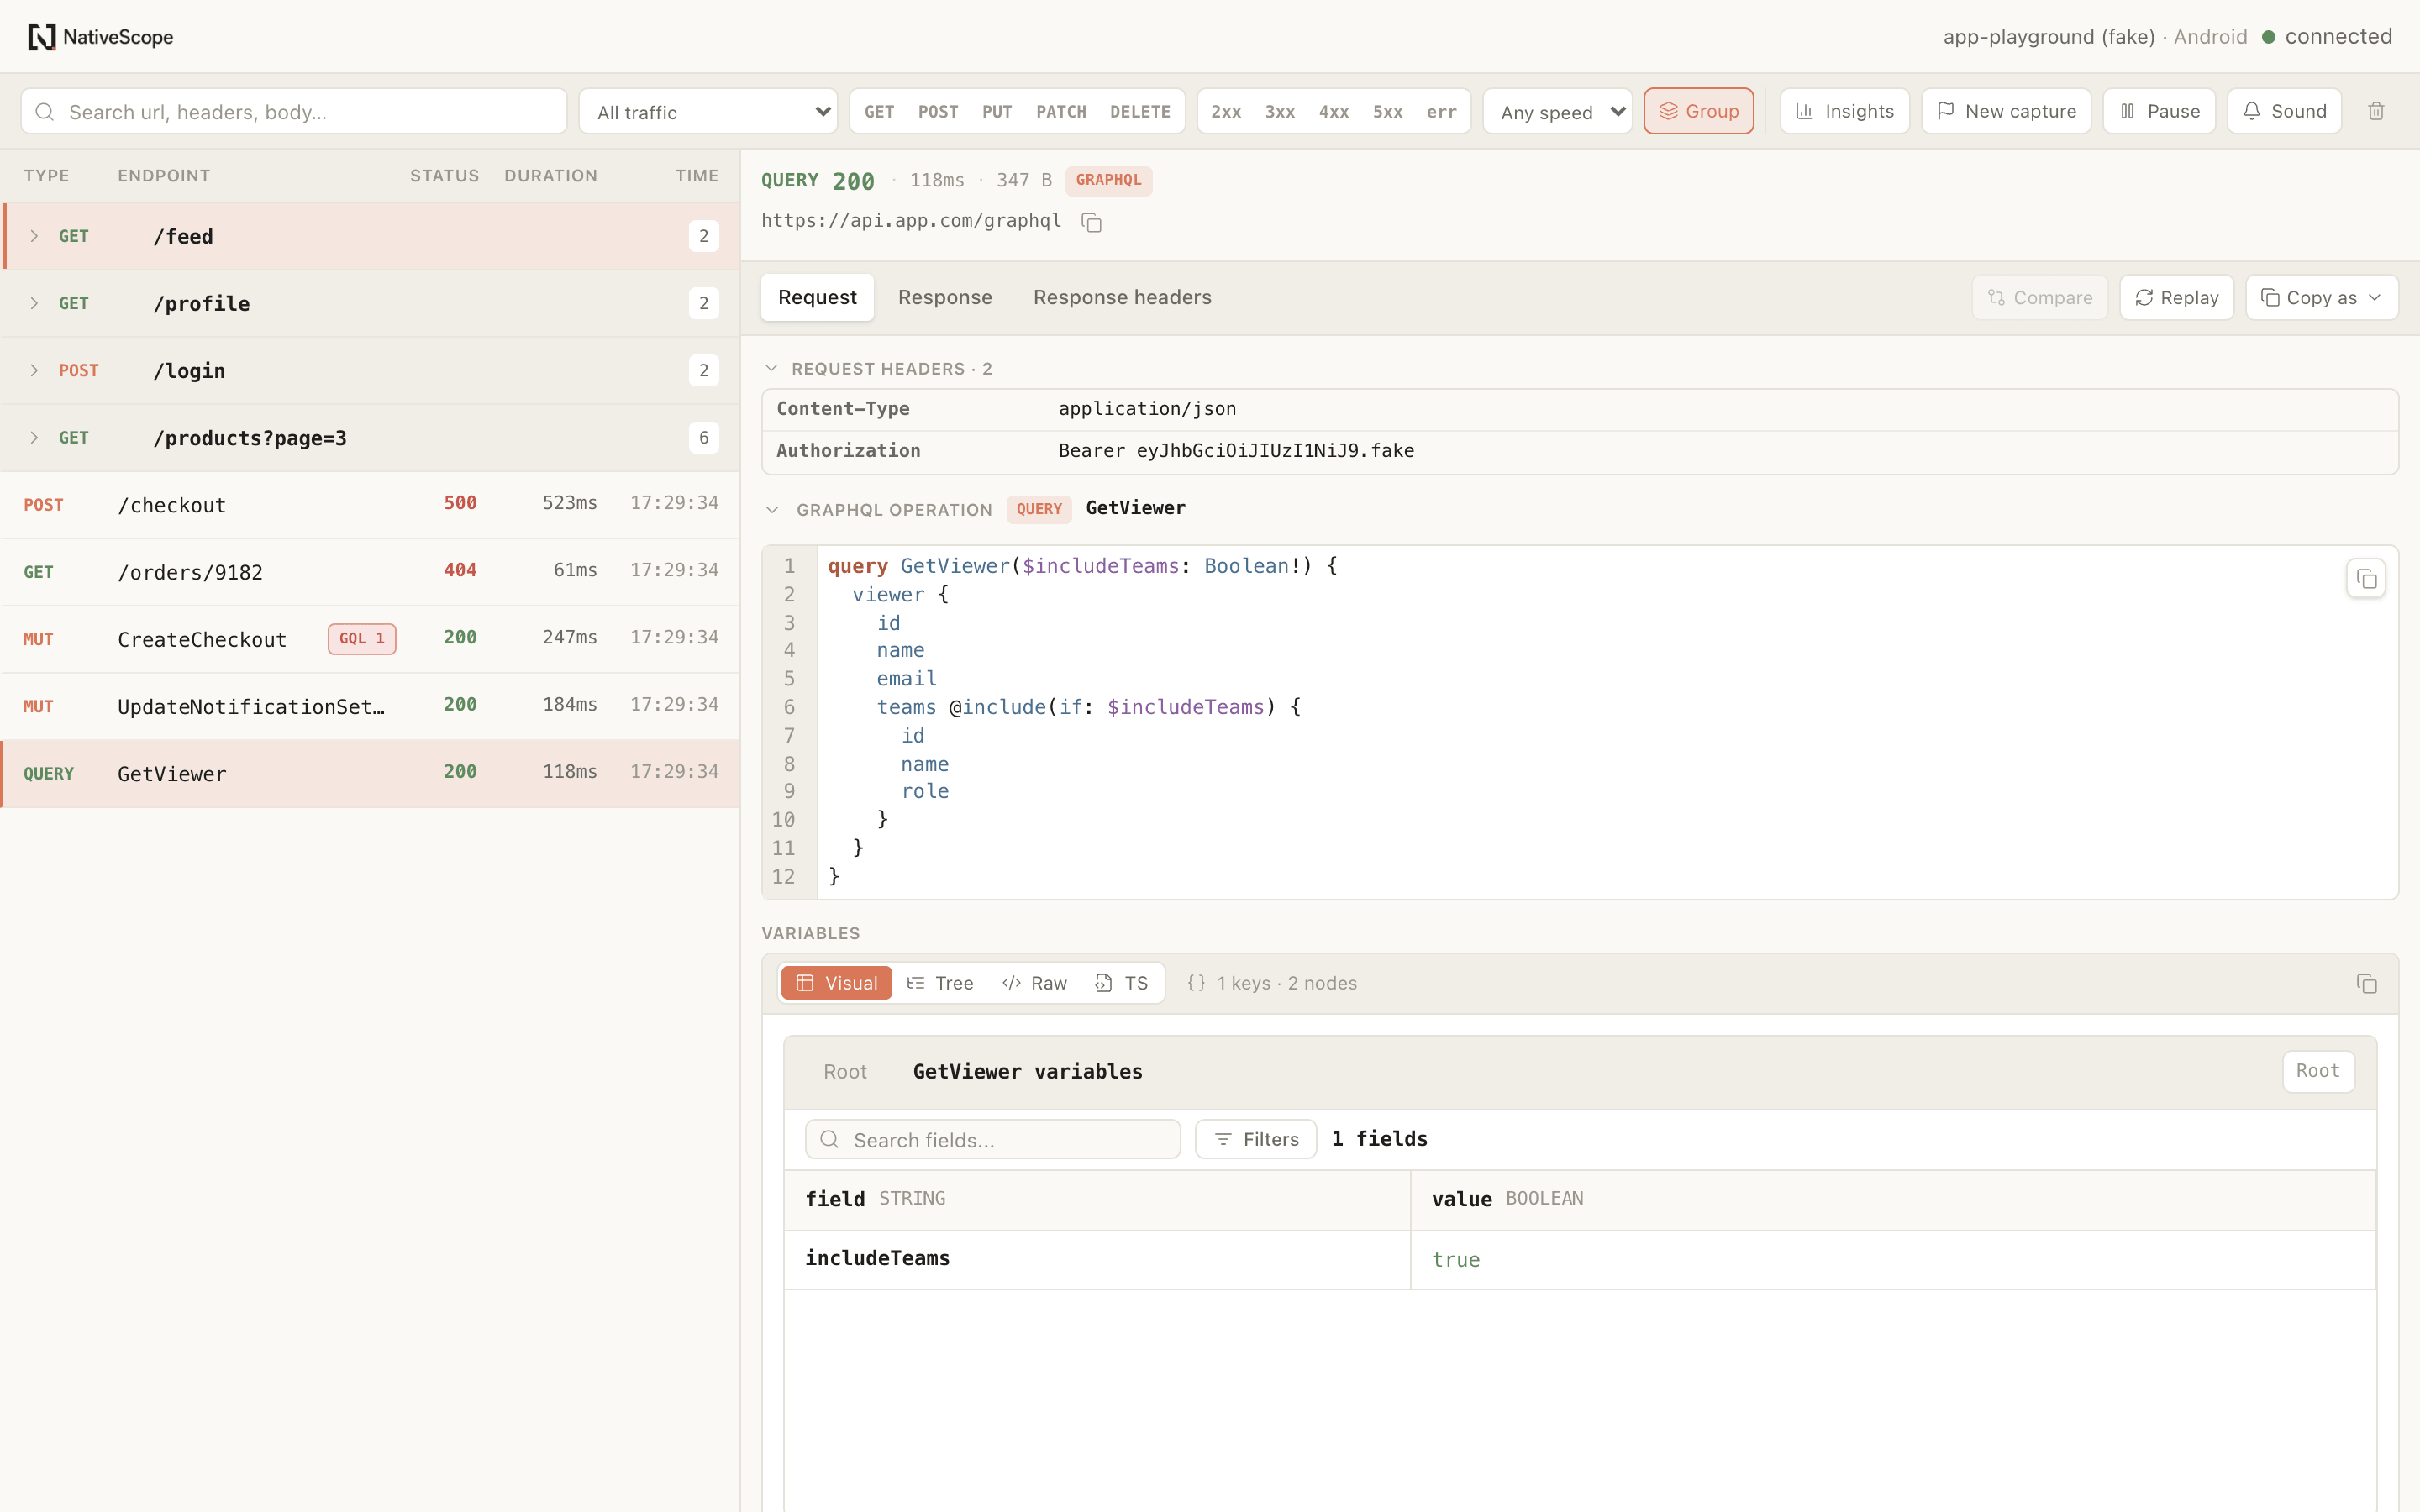
Capture HTTP and GraphQL, find the exact call, inspect the complete exchange, replay with control and follow a response into the storage it changed. Fully local, inside the same Studio.
HTTP + GraphQLone operation-aware timeline
fetch + XHRautomatic development capture
1 lineto enable the whole module
0 cloudaccounts, proxies or remote dashboards
GetViewer/graphql
200UpdateSettings/graphql · 2 variables
GQL 1/api/profileHTTP · 148 ms
200/checkoutHTTP · 1.2 s
409One timeline, two protocols
NativeScope recognizes GraphQL over HTTP automatically. Queries, mutations, persisted operations and batches keep their operation names, variables and semantic errors without another client adapter or schema upload.
Control the session
Capture controls, filtering and session-level analysis stay close to the timeline without changing how your app makes a request.
Start a new capture from this moment, keep earlier traffic behind a marker and return to it whenever context matters.
Learn moreCombine URL, header and body search with method, status, duration, protocol and GraphQL operation filters.
Learn moreInspect request, response and headers separately. Large bodies stay bounded, then load completely only when requested.
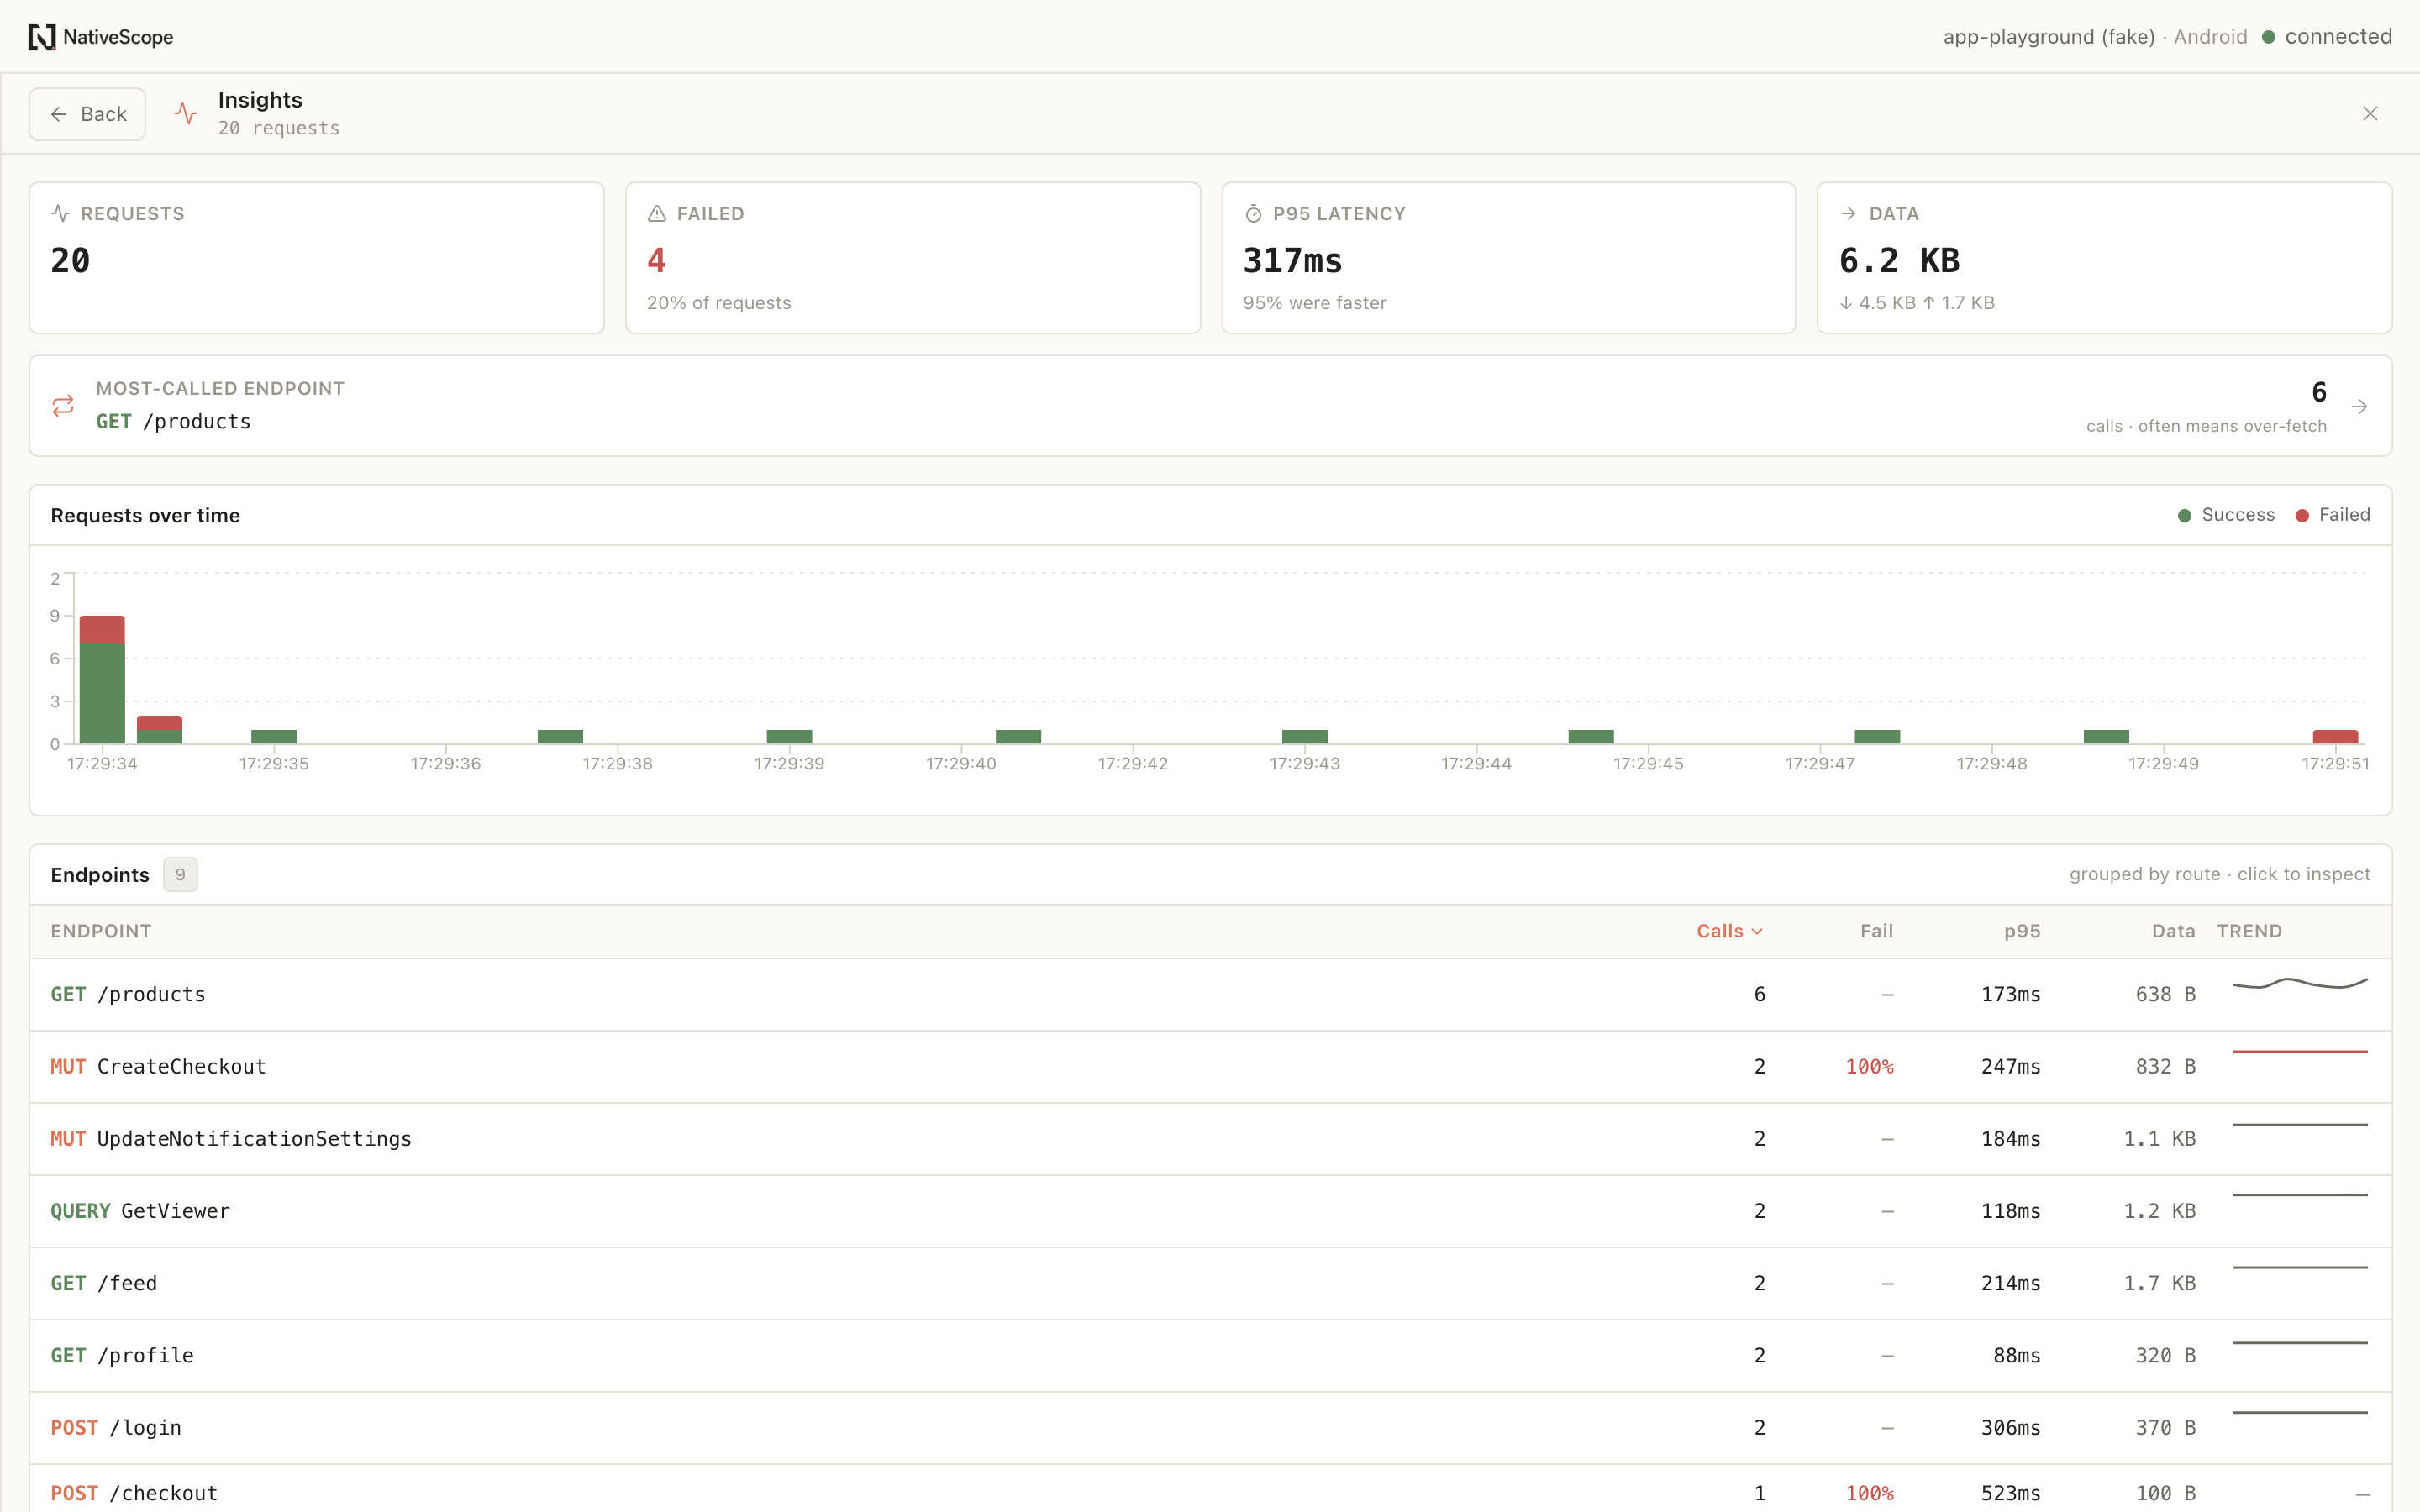
Learn moreOpen Insights for request volume, failures, p95 latency, transferred data, a timeline and endpoint-level drill-down.
Learn moreUse a local sound for every request, failures only or selected endpoint rules, with a compact volume control.
Learn moreSee which storage entries changed immediately after a response and open the exact value in the Storage module.
Learn moreReplay HTTP and GraphQL
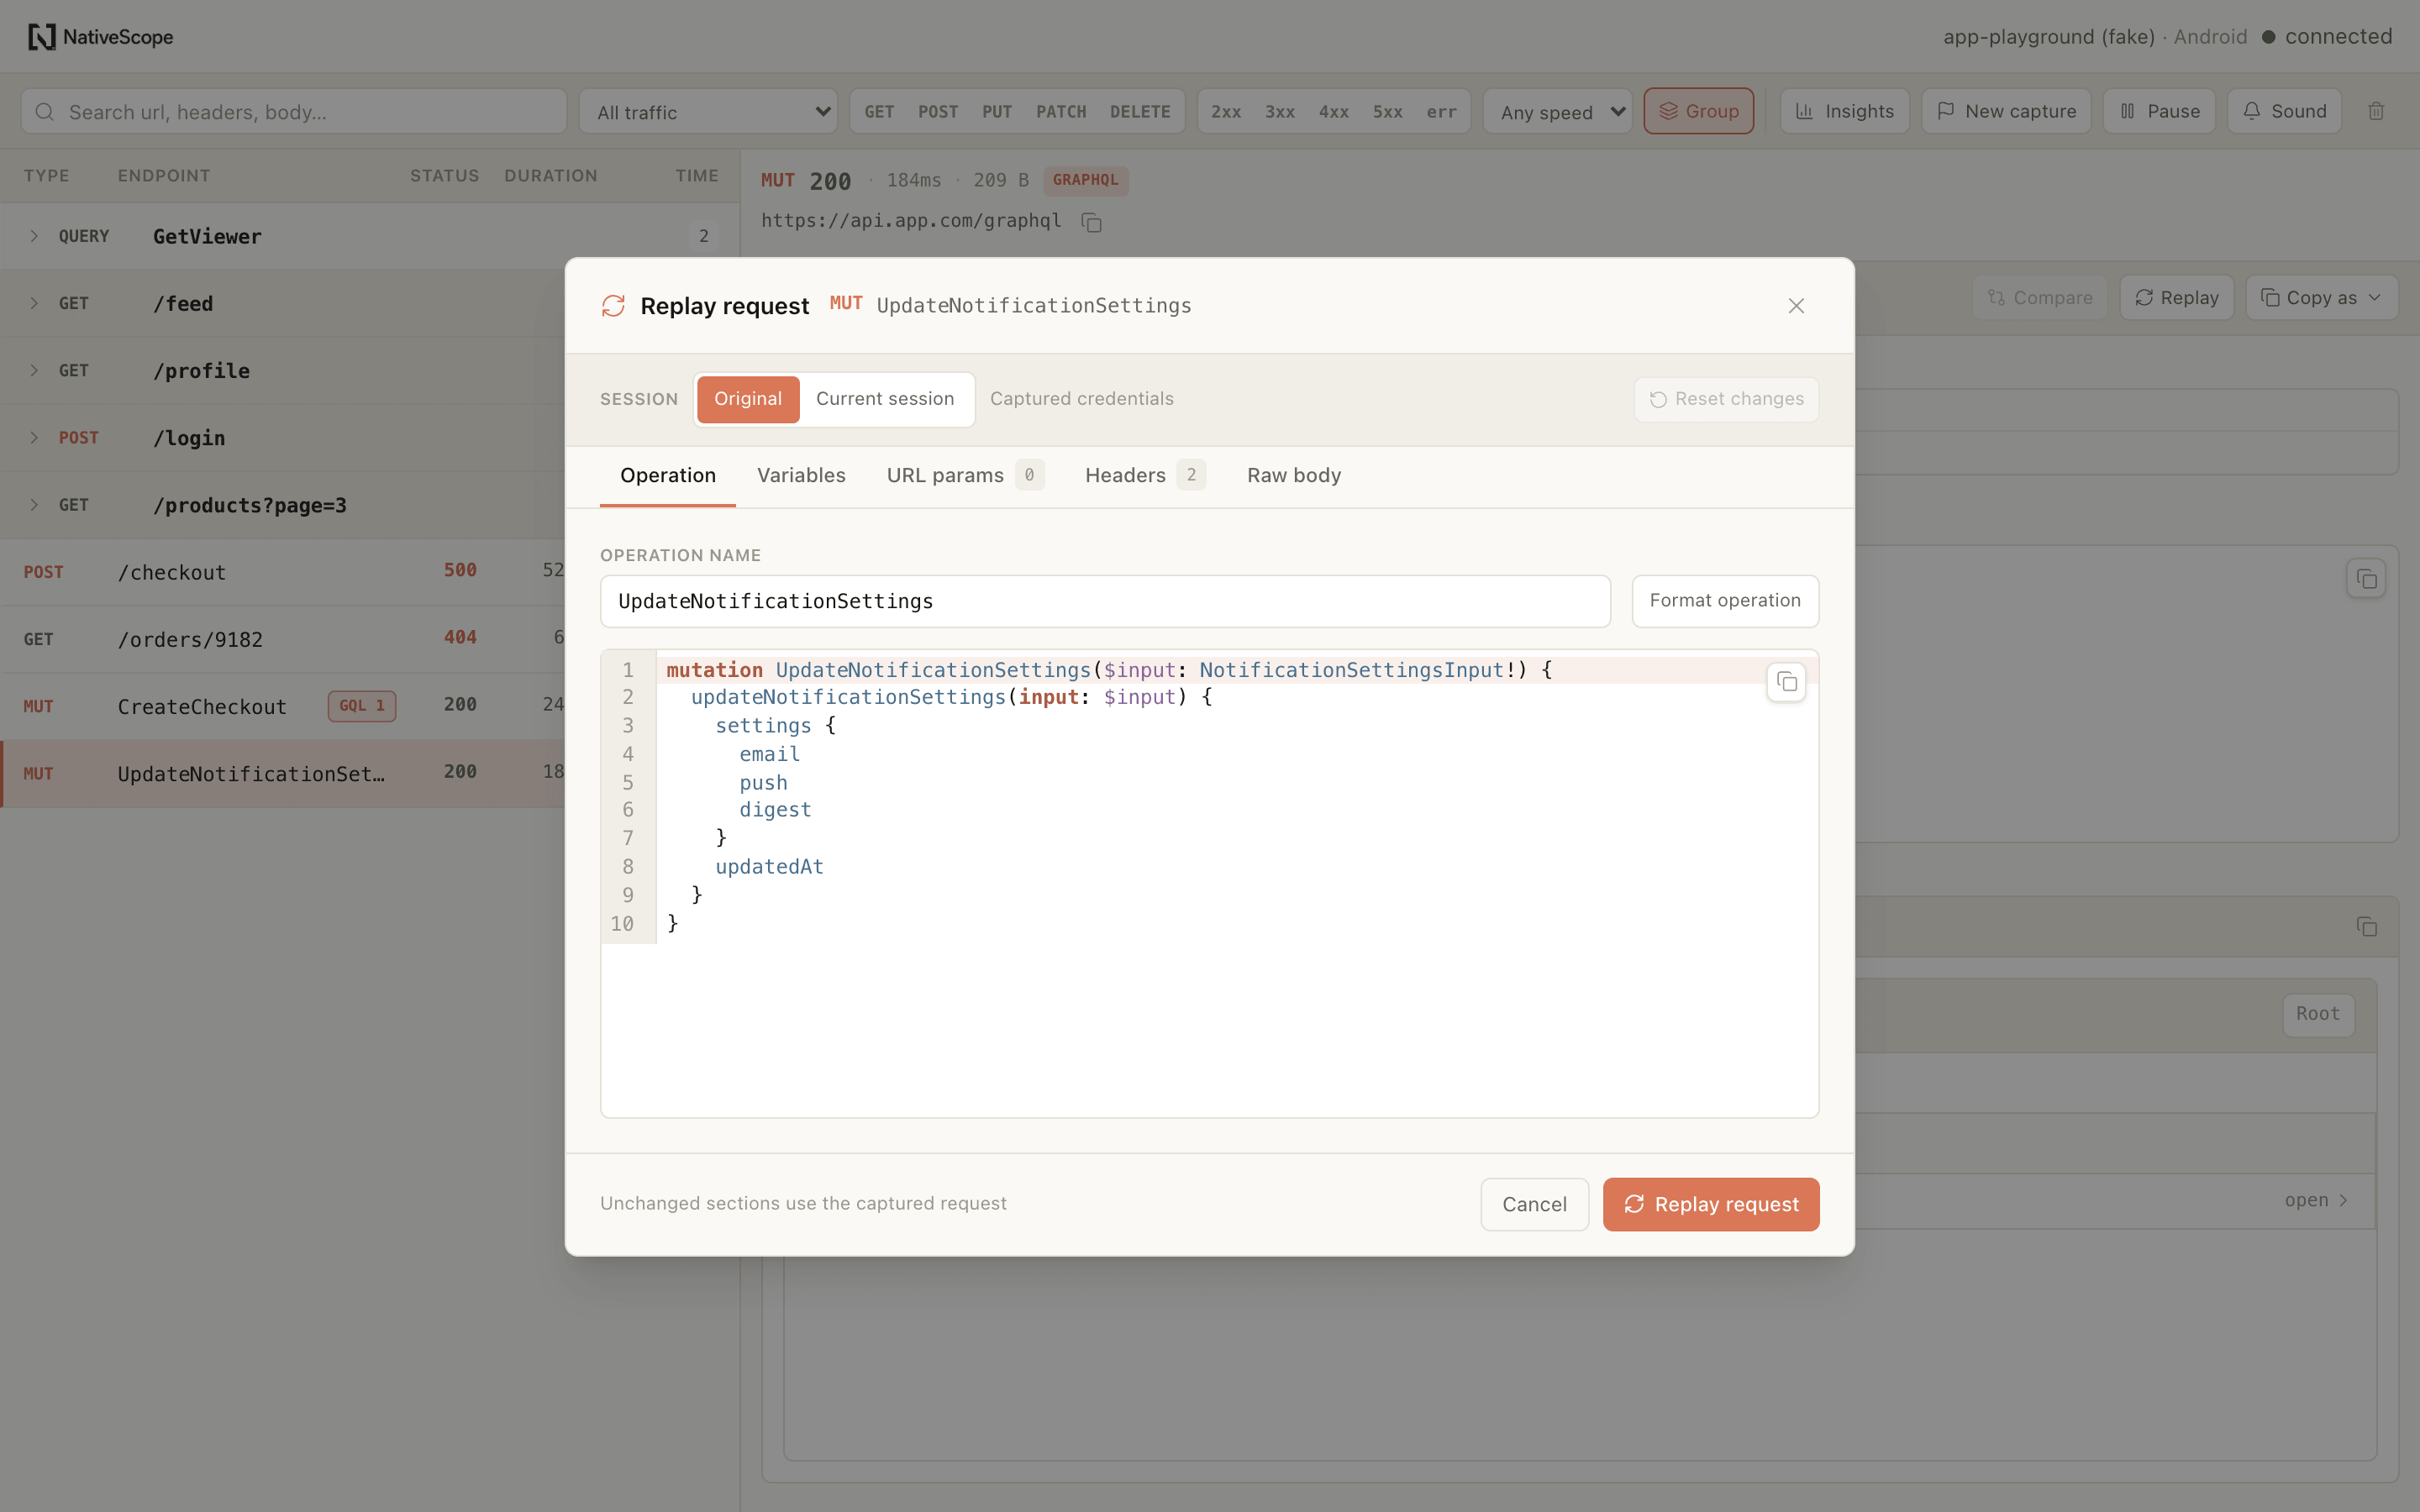
Query parameters and headers are structured rows. Common header names are suggested but never forced. JSON bodies are formatted and validated; GraphQL gets dedicated Operation and Variables editors. Untouched sections keep the captured request exactly as it was.
Network Insights
Step back from individual payloads without leaving the Studio. Insights turns the current capture into a readable overview of volume, failures, p95 latency, transferred data and endpoint behavior across HTTP and GraphQL.
The whole integration
Use the defaults first. Fine-tune body capture, limits, ignored URLs and redacted headers only when the app needs it.
See every optionimport { defineNativeScopeConfig } from
"react-native-nativescope/app"
export default defineNativeScopeConfig({
modules: {
network: true,
},
})Useful boundaries
Preview first. Large payloads send a bounded preview to keep the request list responsive. The full body loads on demand, with a 32 KB preview and 2 MB retention limit by default.
Buffers stay finite. Request history and retained bodies have explicit, configurable limits instead of growing with the session forever.
Your credentials stay local. Redact additional headers when necessary, and remember that replay performs a real request with real side effects.
Network is live